
Creating Space: A Quantitative Evaluation of Offensive Line Run Blocking

Public NFL player metrics have grown dramatically over the past decade. We now have advanced stats like CPOE (completion percentage over expected), YAC (yards after catch), EPA (expected points added), pressures, and many more. Each of these metrics can aid in player evaluation. However, one group’s impact remains especially challenging to quantify through metrics: offensive linemen.
Offensive linemen are the foundation of any productive offense, driving an effective running game and enabling successful passing plays. This study focuses specifically on quantifying offensive line run blocking. The offensive line operates as a cohesive unit—whether executing zone blocking schemes that create lateral or vertical space, or gap concepts where a single missed block can derail the entire play. Because of this interdependence, most publicly available offensive line stats are measured at the unit level. For example, Next Gen Stats provides Line Yards and Yards Before Contact metrics, while Pro Football Reference tracks stuff rate and rushing success rate. These metrics are valuable for analyzing the offensive line as a whole, but fall short for evaluating individual player contributions.
To address this gap, I use player tracking data from the 2025 NFL Big Data Bowl, covering Weeks 1–9 of the 2022 NFL season. This dataset provides x–y coordinates and movement information for all 22 players on every play, enabling detailed spatial analysis of blocking performance.
Methodology
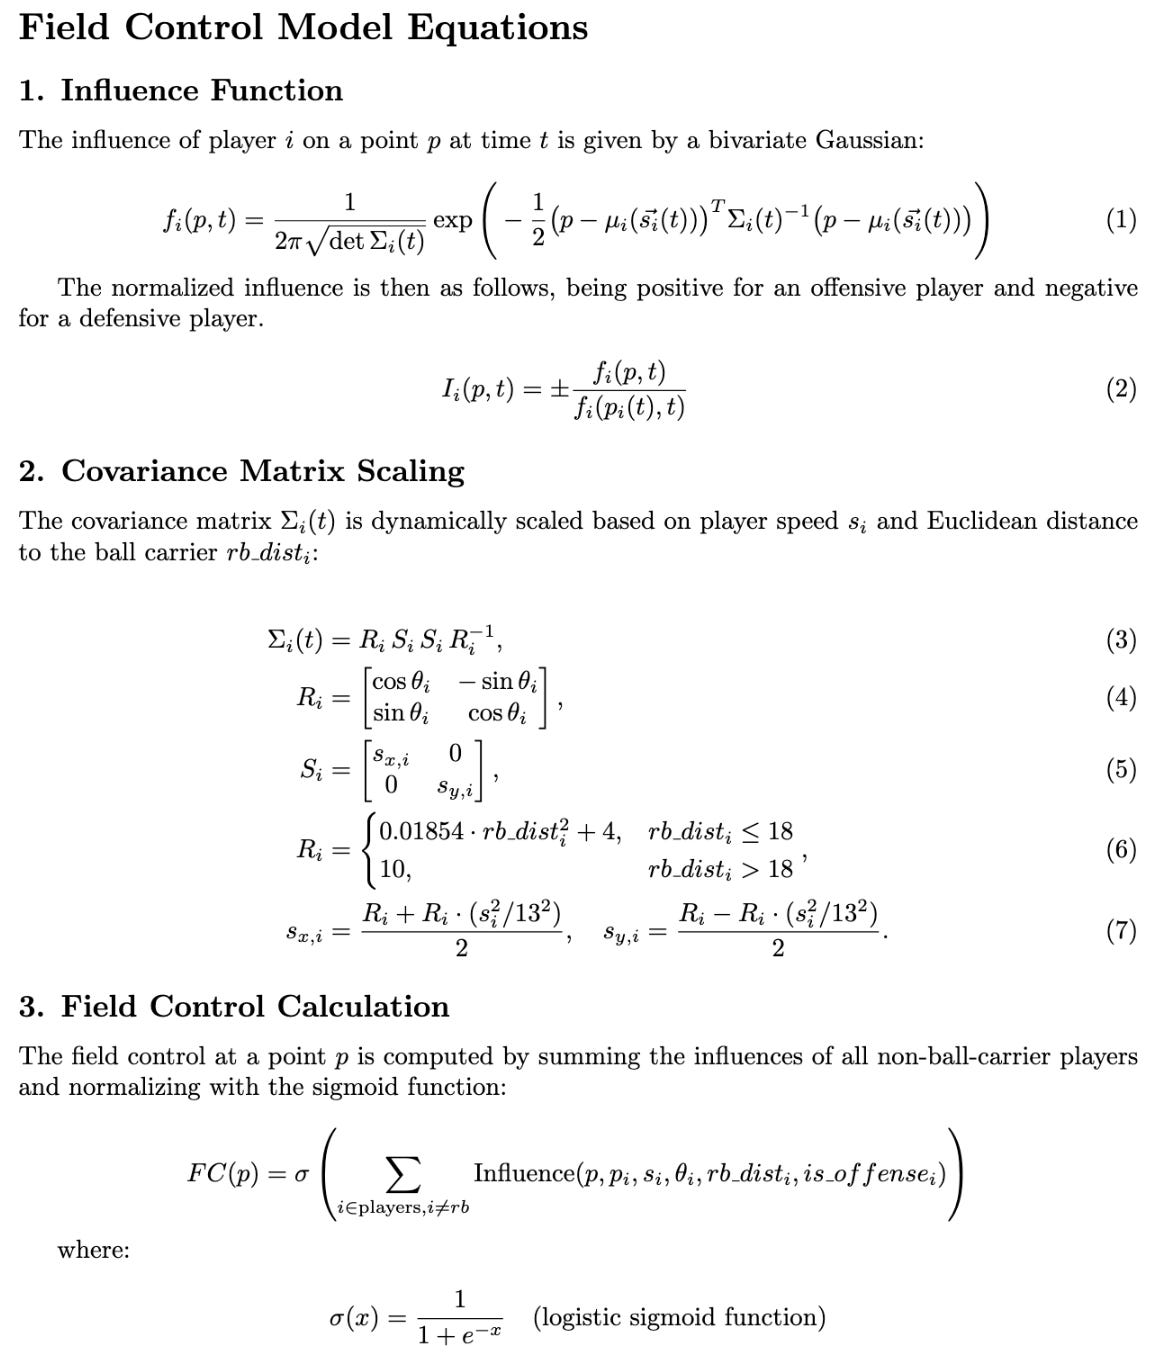
The goal of this study is to quantify each lineman’s individual contribution to a run play’s success. To do this, I adapted a concept for measuring space ownership originally developed in soccer analytics: player influence and pitch control [1]. This method uses bivariate Gaussian distributions to estimate which player can reach any given point on the field fastest, factoring in each player’s location (x-y coordinates), speed, and direction. In contrast to the original approach, two key adjustments are made for football: first, points closer to the ball carrier are weighted more heavily, reflecting their greater relevance to the rush play success; second, the ball carrier is excluded from the field control calculation, so the measure reflects only which offensive or defensive players can reach a point fastest to block for or tackle the running back. The exact equations are shown in the appendix. Since this is American football, I will refer to pitch control as field control going forward.
By summing the control values of all 22 players on the field (offense positive, defense negative), we get a dynamic spatial map of dominance, normalized between 0 and 1 using a sigmoid function. A field control value of 0.5 means both teams can reach that location equally fast; values closer to 1 indicate offensive dominance, and values near 0 indicate defensive control.

On running plays, offensive linemen strive to control the gaps and carve out space for the running back to exploit. To measure this, I focus on the space immediately ahead of and around the running back. Inspired by the Big Data Bowl submission Pull the Plug [2], I use the running back’s vision cone. It’s defined as a 90-degree angle in the direction of movement extending 3 yards, plus the circular space within 1 yard around the back. The frames analyzed start from the handoff and continue until the running back is tackled or breaks through the convex hull formed by the five offensive linemen. Over these frames, the average field control within the vision cone is calculated.
The RB’s vision area field control starts with offensive ownership, but then decreases as he crosses through the offensive line. This approach produces a unit-level measure of blocking effectiveness: on average, higher vision-cone field control at the start of the play is associated with more rushing yards gained (R² = 0.181). While this establishes that the offensive line collectively shapes the outcome of the play, it does not yet answer the more difficult question—how much each individual lineman contributes to that collective space creation.

Assigning Individual Contributions - Field Control Added
To bridge this gap, I employ a Leave-One-Out (LOO) approach. For each play, I calculate the vision-cone field control with all lineman present, and then recalculate the vision-cone field control after removing one lineman’s influence from the model. The resulting change in field control represents that player’s marginal impact on creating space for the ball carrier. From this, I created a metric called Field Control Added (FCA), which is the average FC contribution of each lineman over the course of all of their plays. This method captures both direct effects (e.g., a lineman sealing his defender) and indirect effects (e.g., drawing a defender away, allowing teammates to maintain leverage). By aggregating these values across plays, we obtain a player-level metric of run-blocking contribution, offering a more granular view of performance than traditional unit-level offensive line stats.
Metric Reliability and Team-Level Validation
To evaluate the stability of the FCA metric, I tested its ability to predict future performance. Specifically, I calculated each player’s average FCA from Weeks 1–5 and compared it to their average FCA from Weeks 1–9, grouped by position. The results suggest that FCA shows moderate predictive power for interior offensive linemen, with R² values in the range of 0.15–0.25. In contrast, exterior linemen (tackles) exhibited much weaker stability, with R² values below 0.1.
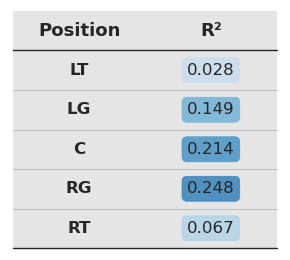
Correlation between each player's average FCA in Weeks 1–5 and their average FCA in Weeks 6–9 suggests that FCA, in its current form, is more effective at capturing the contributions of guards and centers than those of tackles. One explanation is the broader set of responsibilities tackles face on run plays — including pulling, sealing the edge, and reaching second-level defenders — which may not be fully captured by the present attribution framework. Further work is needed to refine how FCA accounts for these diverse assignments in order to better evaluate tackle performance.
At the team level, combining the FCA values of all five linemen over nine weeks and regressing them against team rushing yards before contact yields an R² of 0.237. This result highlights that while individual FCA stability varies by position, the metric still demonstrates meaningful predictive power when aggregated, reinforcing its potential value as a measure of collective offensive line performance.
Results & Analysis
To evaluate how well FCA captures individual lineman performance, we begin by examining centers, followed by guards and tackles. The center position offers a useful test case: centers are involved in nearly every run concept, often facing head-up nose tackles in gap schemes or working in tandem on double-teams in zone blocking.
Centers
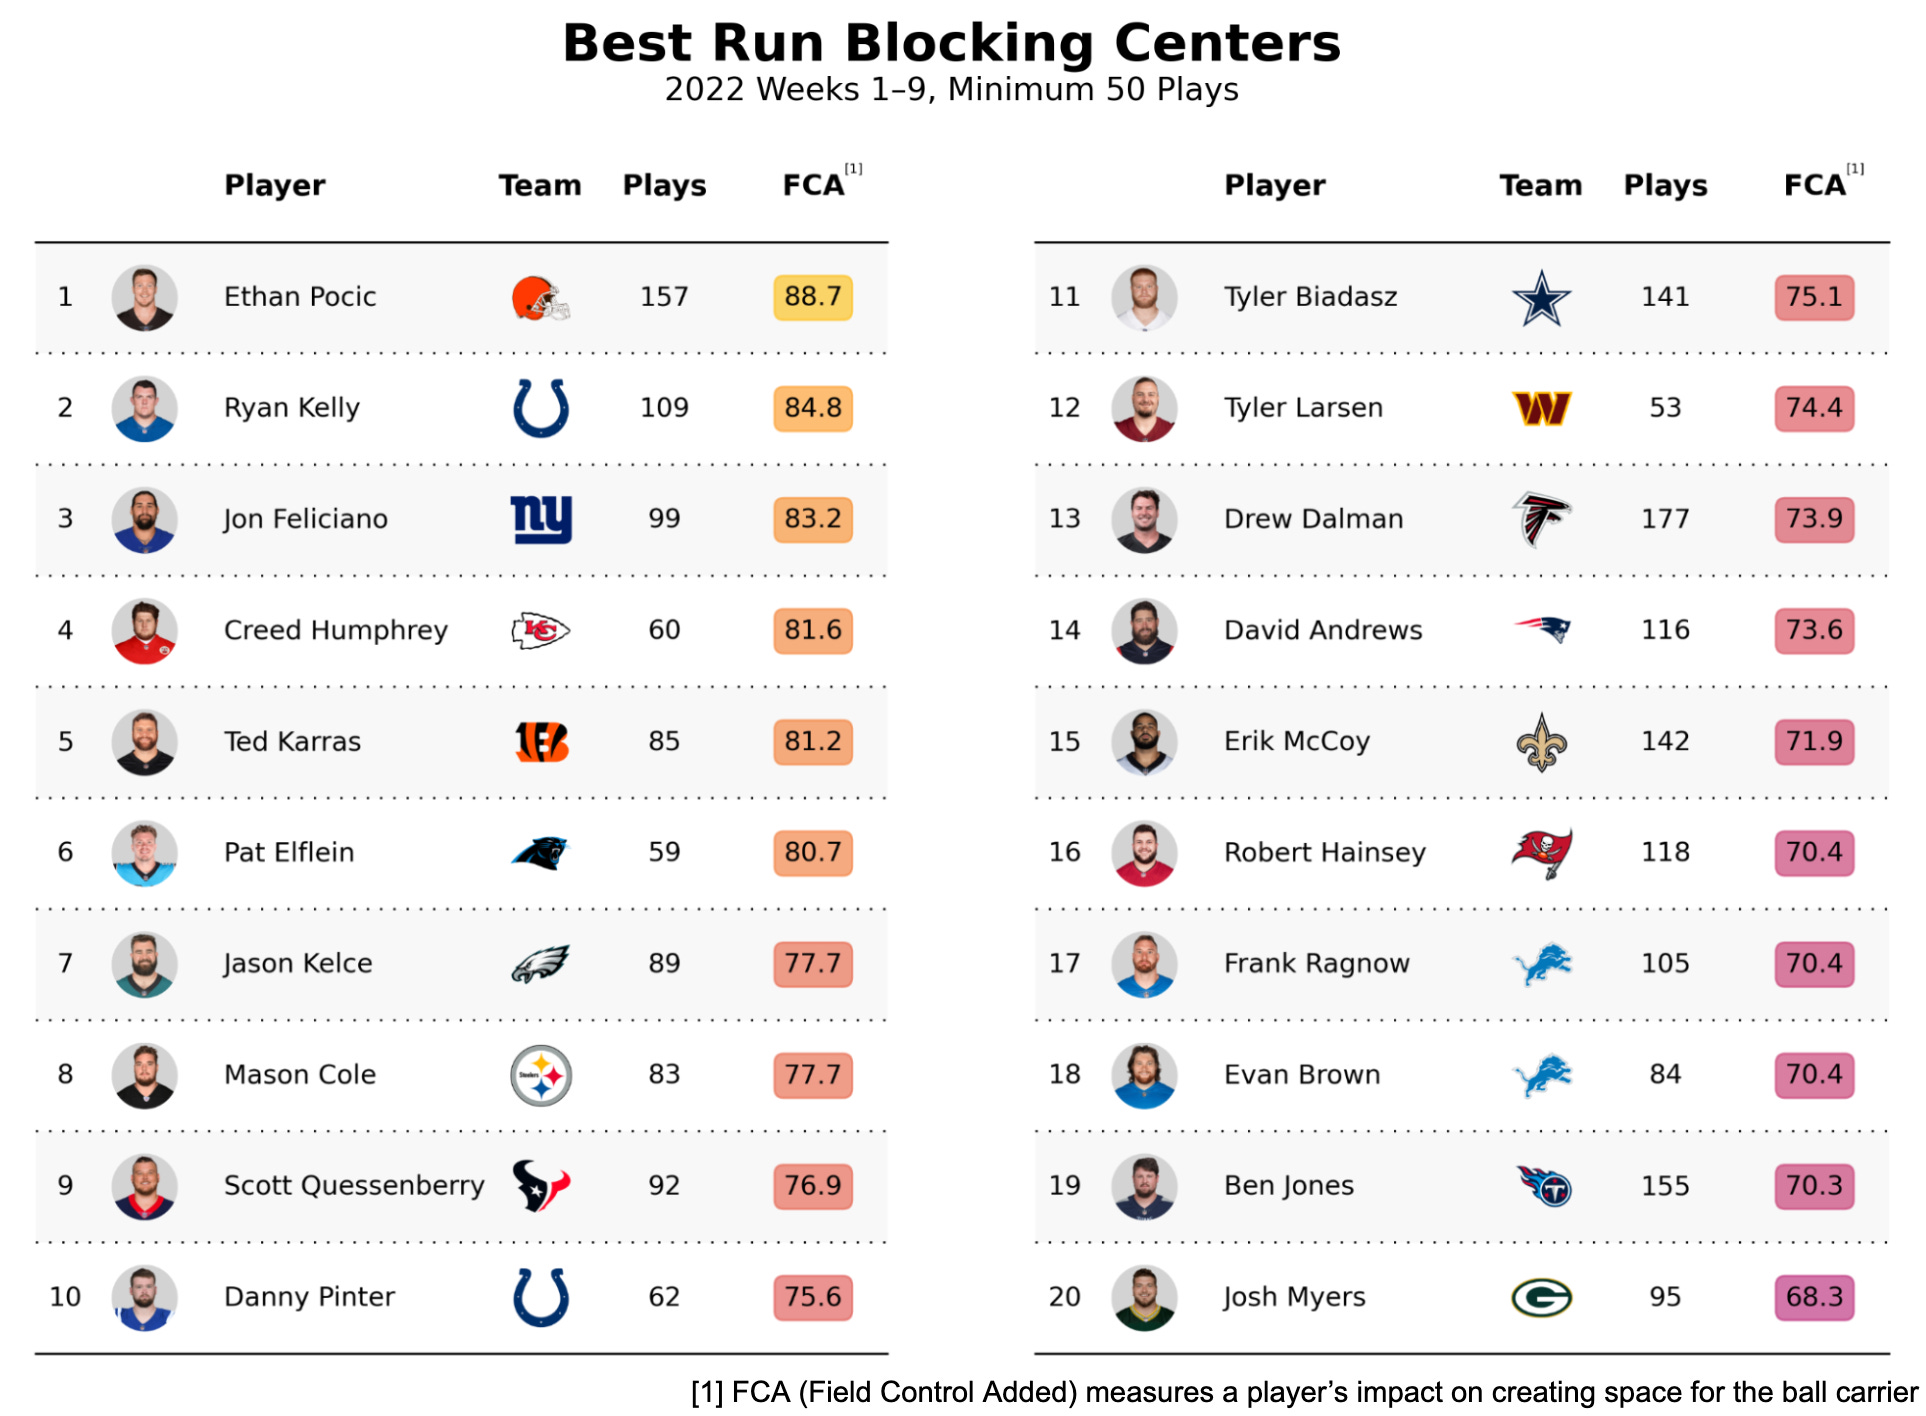
Elite performers align with external benchmarks. Ethan Pocic of the Cleveland Browns ranks first among all centers (88.7 FCA). This agrees with Pro Football Focus grades, which also placed Pocic as the second best run blocker of the 2022 season behind Creed Humphrey [3]. Similarly, Ryan Kelly (Colts) and Creed Humphrey (Chiefs) appear near the top, both of whom have multiple All-Pro and Pro Bowl seasons on their resumes.
Well-established veterans remain effective. Jason Kelce, a perennial All-Pro, appears within the top 10 despite playing fewer run snaps than some peers.
Undervalued contributors emerge. Names like Jon Feliciano (Giants) and Ted Karras (Bengals) score highly despite receiving limited mainstream recognition.
Workload versus efficiency. Some centers with heavy workloads, like Drew Dalman (177 plays), ranks outside the top 10. This illustrates FCA’s strength in capturing efficiency of space creation since it is on a per play level, rather than simply rewarding players on high-total rushing attempts.
Guards
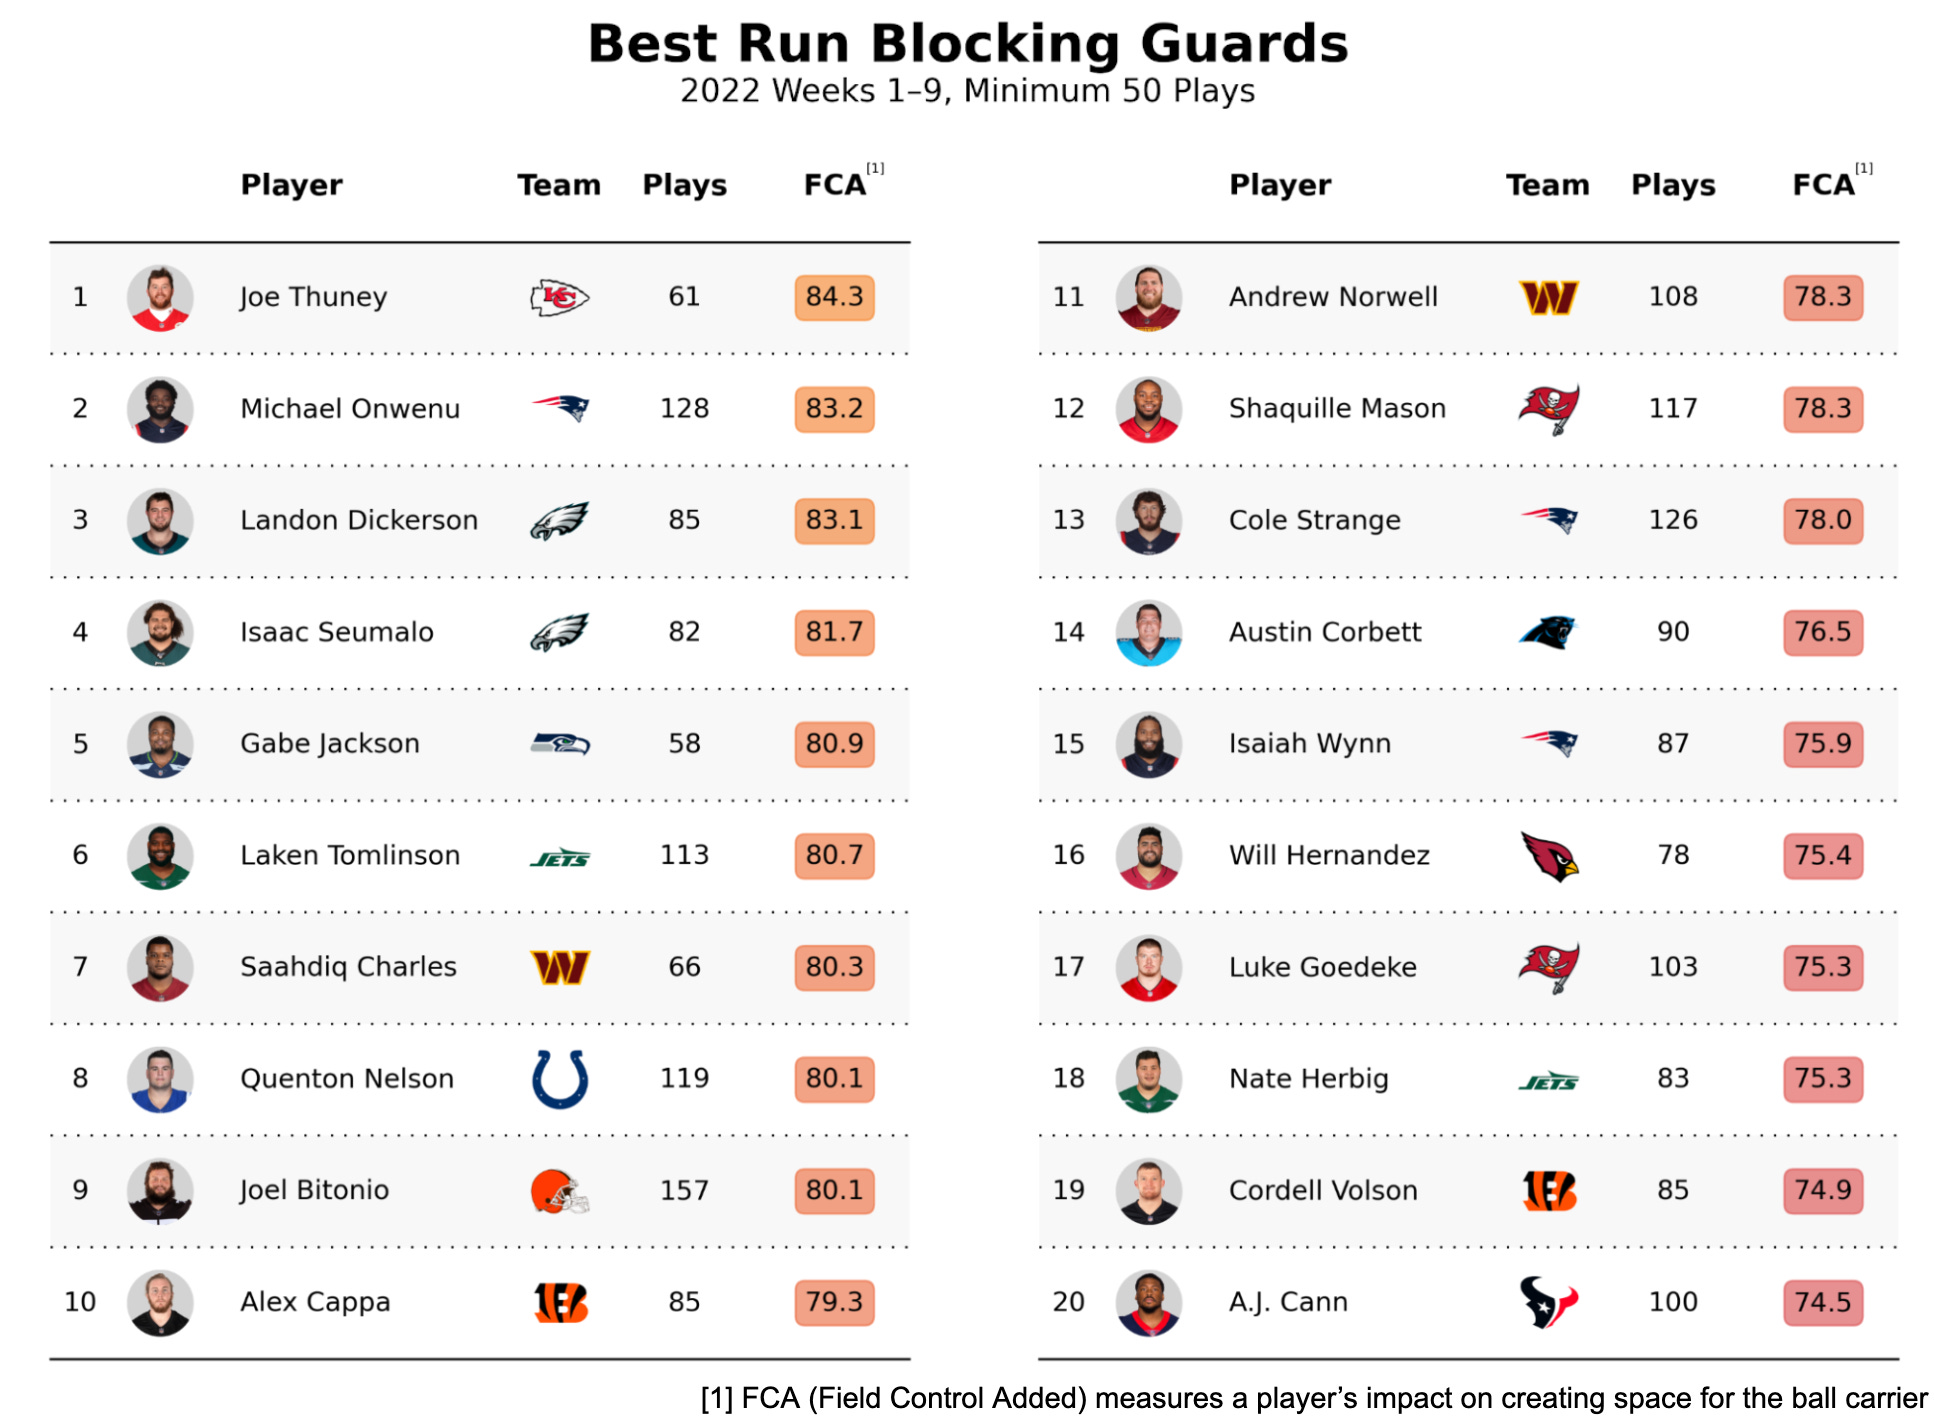
Elite Guards Validate the Metric. Established stars like Joe Thuney (1st), Quenton Nelson, and Joel Bitonio (both top 10) anchor the list, confirming FCA aligns with proven top-tier talent.
New Names. The list also identifies highly effective, under-the-radar run blockers. Landon Dickerson (3rd) and Michael Onwenu (2nd) rank among the very best in the first half of 2022, signaling potential value in free agent acquisition.
Tackles
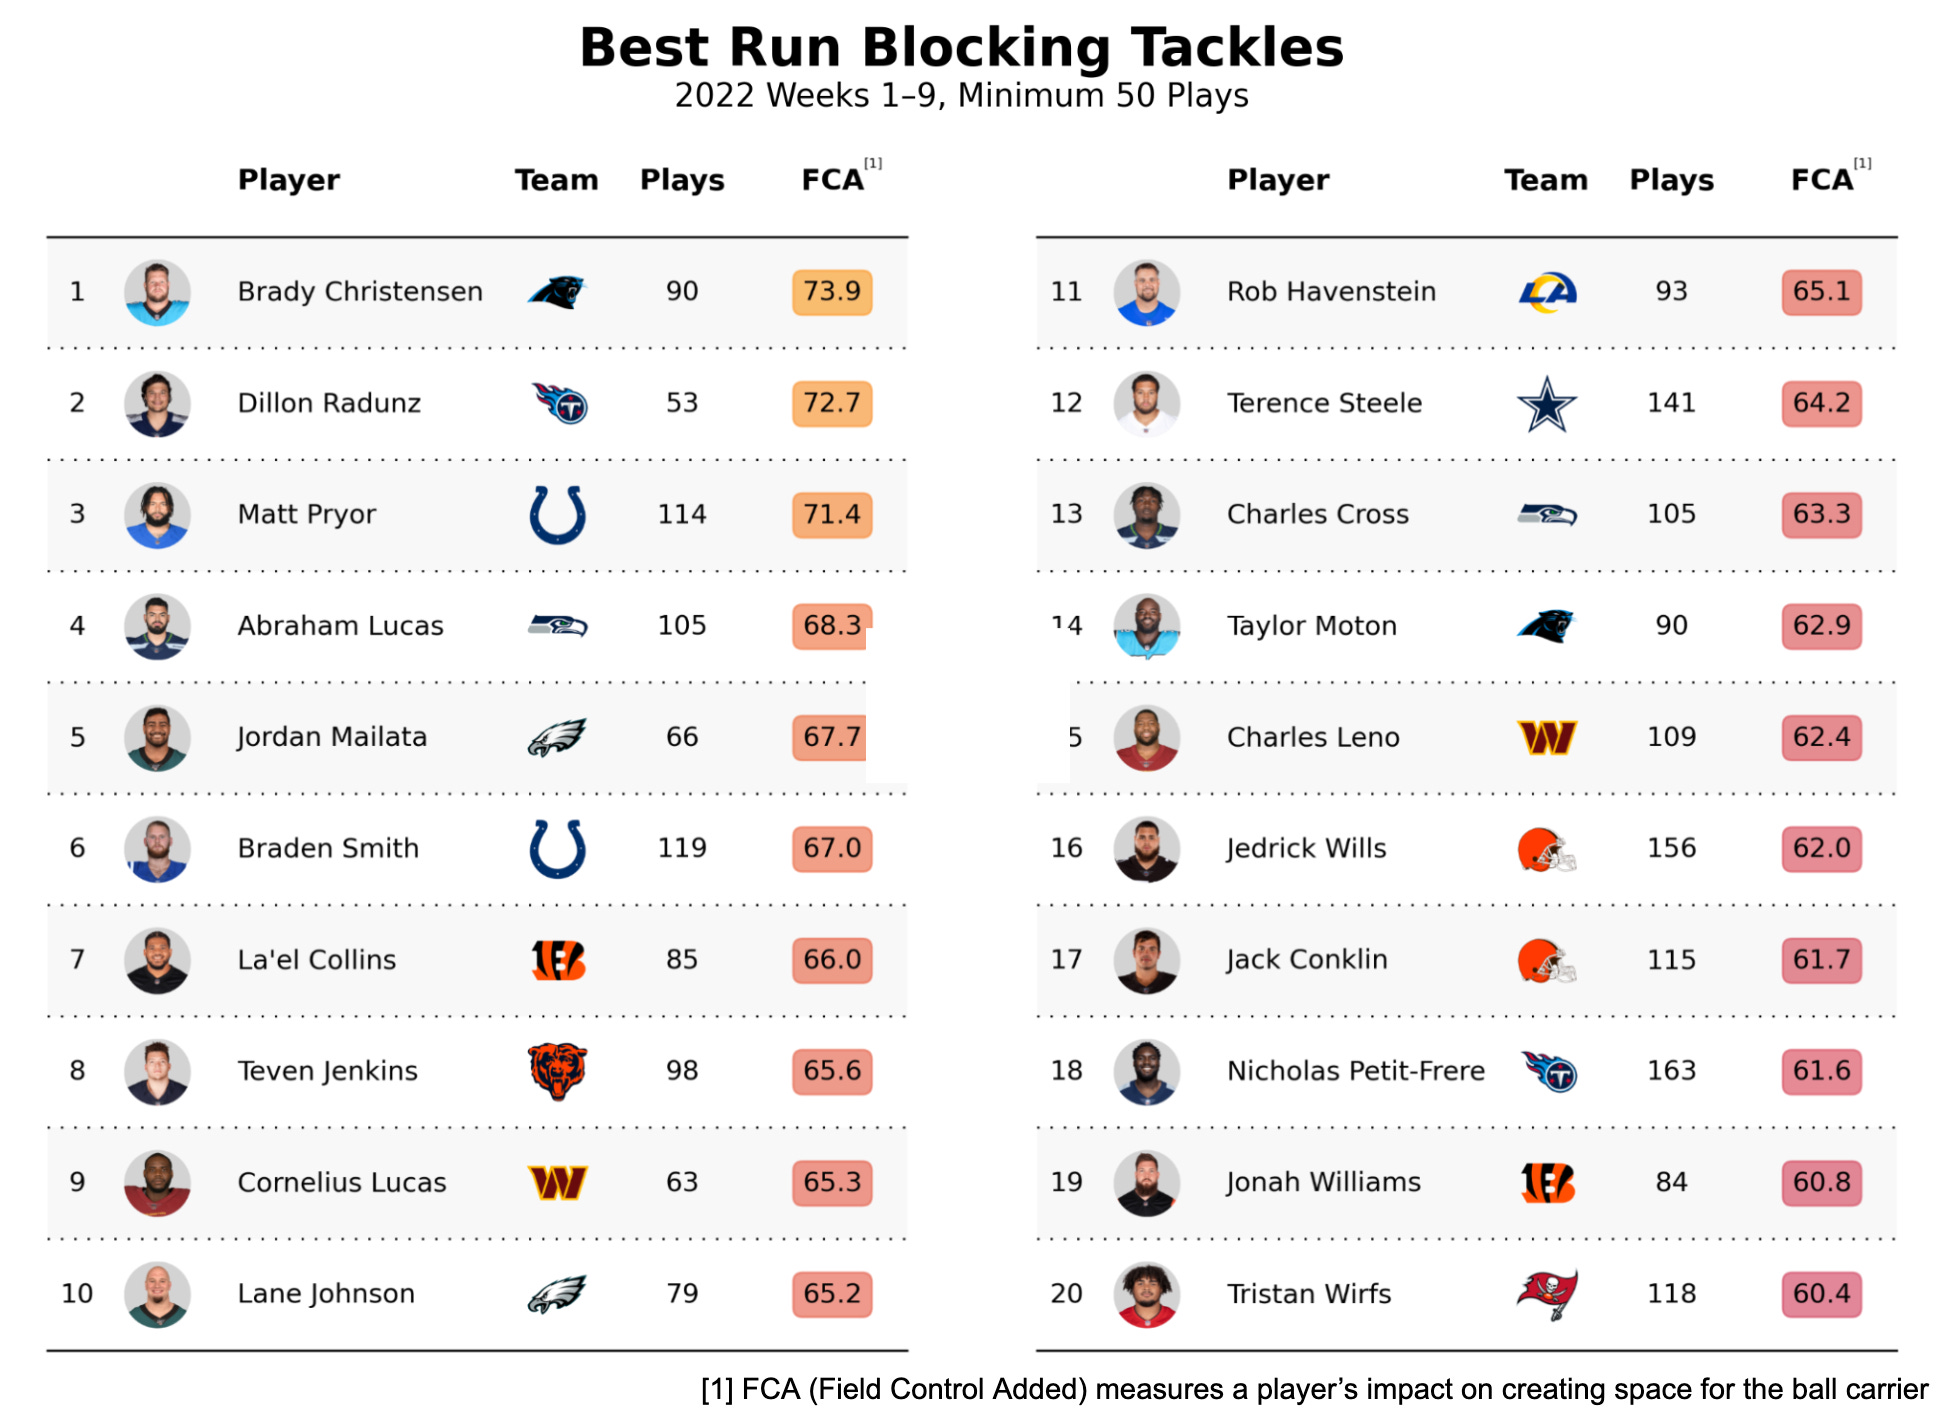
Lower FCA values compared to other positions. No tackle surpasses the 74.0 FCA threshold, reflecting differences in positional proximity to the ball carrier. Centers, positioned directly over the ball, and guards, aligned close on either side, are consistently involved in shaping the running back’s immediate space. Tackles, however, may be lined up on the opposite side of the play, farther from the running back’s path. As a result, their per-play Field Control Added values tend to be lower.
Future Work
Several extensions could strengthen the FCA framework:
Situational Normalization. Current values are context-agnostic; normalizing for defensive alignment (e.g., defenders in the box, run blitzes, or front alignment) would help isolate a lineman’s true contribution from external factors.
Replacement-Level Benchmarking. Incorporating simulations of how a replacement-level player would perform in a given situation could provide a “value over replacement” perspective, offering clearer context for front offices or analysts evaluating talent.
These steps would improve both the stability and interpretability of the metric, bringing it closer to a robust tool for evaluating offensive line performance.
Appendix
Code: https://github.com/lneuendorf/oline-run-blocking-grades
References
[1] Fernández, Javier & Bornn, Luke. (2018). Wide Open Spaces: A statistical technique for measuring space creation in professional soccer.
[2] Davis, B., & Rajendran, N. (2024, January 1). Pull the plug. Kaggle. https://www.kaggle.com/code/bendavis71/pull-the-plug
[3] Spielberger, B. (2022, November 22). Contract extension candidates, projections before the end of the 2022 NFL season. PFF. https://www.pff.com/news/nfl-contract-extension-candidates-projections-free-agency-2022#:~:text=C%20Ethan%20Pocic%2C%20Cleveland%20Browns&text=Despite%20earning%20a%20career%2Dhigh,before%20he%20enters%20free%20agency.
Luke, this is really interesting. Just as you say, it starts in the trenches. Well done. I look forward to reading more of your work.
-Micah